Tuesday, December 1, 2015

Suicide Rates in Old Age: An International Comparison

I have compared elderly suicide rates among 34 countries. As we can easily observe from the figure below, South Korea’s elderly suicide rates are a big problem in the country.
In Korea, among 100,000 people who are 75 years old and over, 109 people committed suicide in 2009. The second-highest suicide rate in this comparison (42/100,000 in Hungary) is less than half of the tragic number.
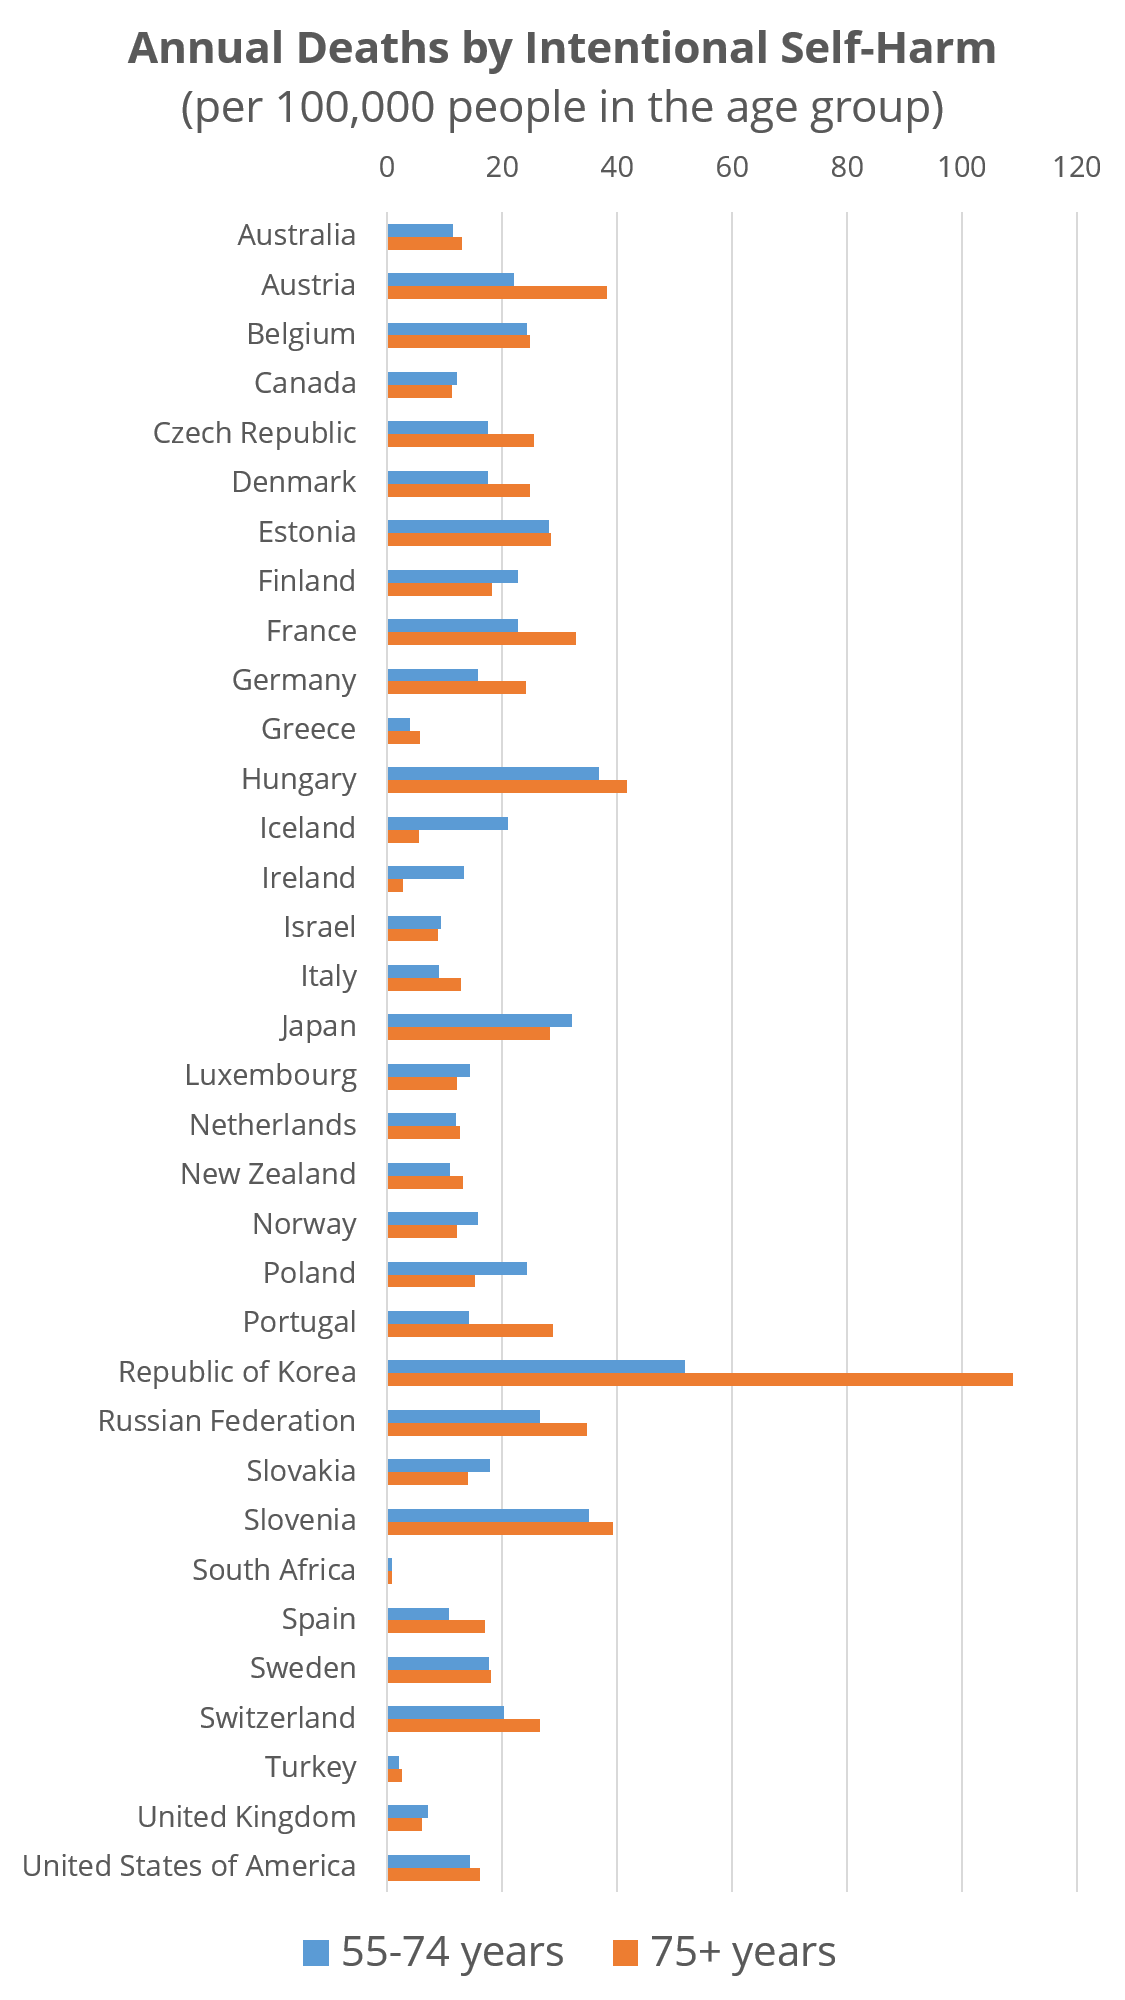

Source: WHO (2014)
Note: All data (‘number of deaths’ and ‘age group population’) are from 2009, except Canada (2005) and United States of America (2007).


South Korea’s high suicide rates among elders might be partially caused by their poverty. Among OECD countries, South Korean elders suffer the most from destitution.
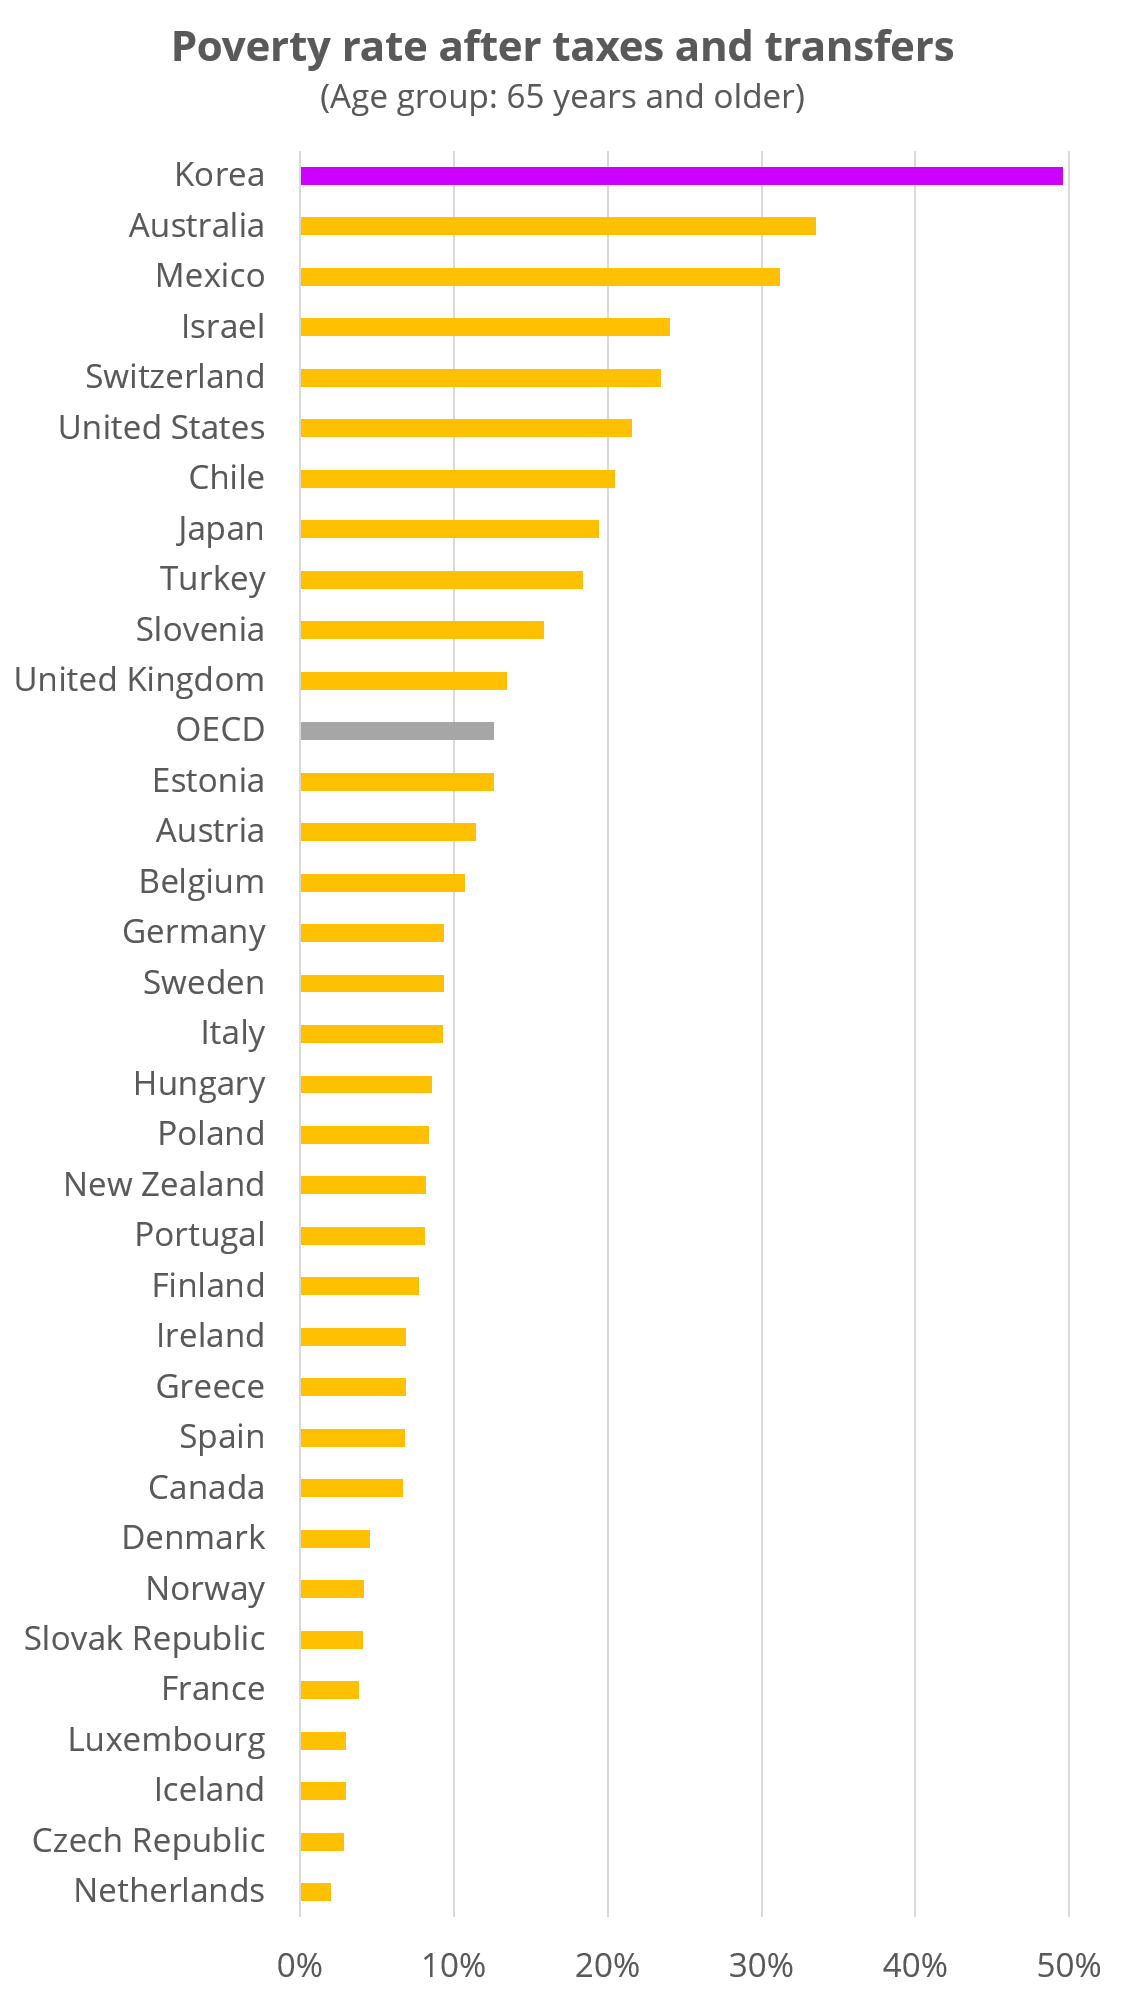
Source: OECD (2015)
Note: All data are from 2013 or most recent year.


References:

Organisation for Economic Co-operation and Development. (2015). Pensions at a Glance 2015: OECD and G20 Indicators. Paris, France: OECD Publishing. [Full-text at http://j.mp/OECD_Pensions_2015]

World Health Organization. (2014). WHO Mortality Database. Geneva, Switzerland: World Health Organization. [Data at http://apps.who.int/healthinfo/statistics/mortality/whodpms/]

Saturday, September 12, 2015

Life Expectancy and Energy Consumption: Countries and U.S. States - an Update

All of a sudden, I wanted to update my old post with the latest data. So I did using the year 2010 dataBelow, I'm presenting a summary plot first, and then you can find the data table.
In general, as you can easily observe from the figure, longer-living people consume more energy. However, the U.S. states look different. The slope of the trend line is negative in the United States.

Life Expectancy and Energy Use: Countries and U.S. States
(All data are from the year 2010.)


Data table:
Country / StateLife expectancy at birth (years)Energy use (tonnes of oil equivalent per capita)
Hong Kong SAR, China82.984.855
Japan82.844.305
Switzerland82.254.272
Italy82.043.178
Iceland81.9017.354
Australia81.706.962
France81.664.278
Spain81.633.383
Israel81.603.269
Singapore81.5414.084
Sweden81.456.113
Malta81.406.489
Hawaii81.305.065
Minnesota81.058.820
Norway81.009.928
Canada80.899.692
Connecticut80.825.342
California80.775.267
Ireland80.743.464
Netherlands80.706.491
New Zealand80.705.122
Faroe Islands80.645.597
Luxembourg80.6310.016
Austria80.584.681
Korea, South80.555.608
Massachusetts80.525.418
New York80.484.813
Vermont80.456.023
United Kingdom80.403.605
Greece80.393.164
New Hampshire80.325.594
New Jersey80.286.879
Belgium80.236.866
Utah80.206.854
Colorado80.027.535
Germany79.994.328
Wisconsin79.987.913
Washington79.927.610
Finland79.876.223
Rhode Island79.874.561
Nebraska79.8411.819
Iowa79.7112.323
Macao SAR, China79.691.293
Arizona79.645.418
North Dakota79.5517.741
Oregon79.526.426
Idaho79.498.316
South Dakota79.4711.642
Florida79.455.720
Slovenia79.423.914
Cyprus79.312.777
Bermuda79.293.571
Costa Rica79.281.044
Lebanon79.251.667
Maine79.197.812
Taiwan79.185.352
Denmark79.103.786
Chile79.051.987
Portugal79.032.623
Virginia79.017.787
Illinois78.967.761
Maryland78.806.401
Kansas78.7210.256
Cuba78.720.908
United States78.547.942
Pennsylvania78.507.434
Montana78.4910.055
Texas78.4511.894
New Mexico78.438.114
Delaware78.367.056
Wyoming78.3423.940
Alaska78.2922.629
Michigan78.237.031
Puerto Rico78.182.543
Qatar78.1518.623
Guam78.105.682
Nevada78.055.997
Brunei77.999.397
North Carolina77.817.081
Ohio77.758.391
Indiana77.6111.163
Missouri77.548.089
New Caledonia77.474.221
Czech Republic77.423.955
Georgia77.238.039
Albania76.981.067
South Carolina76.958.921
Panama76.952.180
Maldives76.790.929
Mexico76.691.634
Uruguay76.621.586
United Arab Emirates76.6018.121
District of Columbia76.537.761
Croatia76.482.194
Tennessee76.308.946
Bahrain76.2611.793
Poland76.252.653
Oman76.058.040
Kentucky75.9711.441
Arkansas75.969.601
Oklahoma75.8810.584
Bosnia and Herzegovina75.812.200
Louisiana75.7122.604
French Polynesia75.691.676
Argentina75.662.156
Ecuador75.651.014
Estonia75.431.579
Alabama75.4210.256
West Virginia75.409.979
Antigua and Barbuda75.332.956
Vietnam75.310.570
Slovakia75.113.543
Saudi Arabia75.088.148
Mississippi74.9610.029
Aruba74.953.699
China74.891.798
Syria74.871.152
Barbados74.801.703
Libya74.793.867
Macedonia74.721.519
Tunisia74.600.740
Bahamas, The74.593.951
Malaysia74.502.709
Montenegro74.422.061
Saint Lucia74.410.960
Serbia74.342.434
Armenia74.221.111
Turkey74.211.454
Hungary74.212.656
Venezuela74.172.988
Kuwait74.1613.257
Peru73.910.767
Cape Verde73.860.273
Thailand73.811.704
Nicaragua73.800.325
Sri Lanka73.760.291
Georgia73.671.054
Bulgaria73.512.607
Latvia73.481.939
Romania73.461.625
Jordan73.441.269
Colombia73.370.783
Belize73.270.960
Lithuania73.271.831
Seychelles73.204.121
Iran73.133.021
Brazil73.081.475
Mauritius72.971.399
Honduras72.850.418
Jamaica72.851.000
Dominican Republic72.790.742
Palestinian Territories (West Bank and Gaza)72.640.299
Samoa72.410.375
Grenada72.340.927
Saint Vincent and the Grenadines72.180.785
Tonga72.180.602
Paraguay72.031.729
El Salvador71.630.519
Guatemala71.000.396
Vanuatu70.840.182
Greenland70.846.004
Cambodia70.640.107
Algeria70.621.312
Egypt70.451.017
Azerbaijan70.451.561
Belarus70.402.940
Suriname70.342.028
Ukraine70.272.801
Morocco70.170.582
Indonesia70.170.649
Kosovo69.901.484
Trinidad and Tobago69.6019.358
Bangladesh69.490.153
Fiji69.380.674
Kyrgyzstan69.300.940
Korea, North68.900.850
Russia68.865.309
Iraq68.831.298
Moldova68.460.819
Kazakhstan68.303.452
Philippines68.230.307
Kiribati67.880.220
Uzbekistan67.861.781
Nepal67.100.073
Solomon Islands67.070.138
Bhutan67.002.076
Tajikistan67.000.654
Laos66.900.293
Mongolia66.890.792
Bolivia66.320.615
Pakistan66.130.357
Timor-Leste (East Timor)65.940.061
Sao Tome and Principe65.850.275
India65.690.491
Turkmenistan65.025.059
Burma (Myanmar)64.580.114
Madagascar63.350.040
Senegal62.840.187
Yemen62.530.389
Namibia62.480.747
Gabon62.290.812
Rwanda62.210.028
Papua New Guinea62.010.243
Haiti61.870.081
Ethiopia61.470.040
Eritrea61.190.042
Mauritania61.020.219
Ghana60.600.208
Djibouti60.290.567
Comoros60.200.066
Sudan and South Sudan59.730.177
Afghanistan59.600.106
Kenya59.550.138
Liberia59.430.052
Tanzania59.180.069
Benin58.750.205
Gambia, The58.130.097
Uganda57.300.050
Congo (Brazzaville)57.200.445
Niger56.990.031
Togo55.470.138
Guinea55.300.059
Burkina Faso55.010.042
Zambia54.530.260
South Africa54.392.910
Somalia54.020.030
Mali53.770.021
Cameroon53.690.163
Zimbabwe53.590.348
Guinea-Bissau53.560.090
Malawi53.470.050
Burundi52.620.012
Equatorial Guinea51.532.638
Nigeria51.290.126
Angola50.650.422
Chad49.770.009
Côte d'Ivoire (Ivory Coast)49.680.147
Mozambique49.140.208
Congo (Kinshasa)48.990.042
Swaziland48.350.340
Central African Republic48.100.032
Lesotho47.480.199
Botswana46.440.923
Sierra Leone44.840.050


Sources:

Energy Information Administration. (2015). International Energy Statistics. Washington, DC: Energy Information Administration. [Data at http://j.mp/TETPB_Countries]

Energy Information Administration. (2015). State Energy Data System (SEDS): 1960-2013 (Complete). Washington, DC: Energy Information Administration. [Data at http://j.mp/EIA_SEDS]

Lewis, K., & Burd-Sharps, S. (2013). The Measure of America 2013-2014. New York, NY: Measure of America. [Full-text at http://www.measureofamerica.org/measure_of_america2013-2014/]

Ministry of the Interior, R.O.C. (2014). Life Tables for Republic of China. Taipei, Taiwan: Ministry of the Interior, R.O.C. [Data at http://j.mp/Taiwan_LE]

World Bank. (2015). Life expectancy at birth, total (years). Washington, DC: The World Bank. [Data at http://j.mp/WB_LE]