Monday, August 28, 2017

Per Capita Residential and Industrial Electricity Consumption in G20 Countries, 2000–2015

It is a maintenance update of my previous post.
I've updated the post's two figures with latest data.

Figure 1: Per Capita Residential Electricity Consumption of G20 Countries, 2000–2015


Figure 2: Per Capita Industrial Electricity Consumption of G20 Countries, 2000–2015


Data sources:

(1) Electricity consumption:
International Energy Agency. (2003). Energy Statistics of Non-OECD Countries 2003. Paris, France: IEA Publications.
International Energy Agency. (2008). Energy Statistics of Non-OECD Countries 2008. Paris, France: IEA Publications.
International Energy Agency. (2013). Energy Statistics of Non-OECD Countries 2013. Paris, France: IEA Publications.
International Energy Agency. (2017). Electricity Information 2017. Paris, France: IEA Publications.
International Energy Agency. (2017). World Energy Statistics 2017. Paris, France: IEA Publications.
(2) Population:
World Bank. (2017). World Development Indicators—July 1, 2017. Washington, DC: World Bank.

Thursday, May 11, 2017

Due to Accelerating Greenhouse Effect, Oceans Are Recently Losing More Oxygen, with Deeper Water Masses Leaking Even Further

We know global oceans are absorbing 93 % of increased Earth’s heat content due to greenhouse effect, which are caused by anthropogenic emissions of greenhouse gases such as carbon dioxide (CO2) and methane (CH4). Are those oceans just very generous bottomless sinks of global heat with no side effects? Of course, “NO”. They have been leaking oxygen into the atmosphere, possibly due to the rising water temperature.

The finding comes from a recent paper published in the journal Geophysical Research Letters. Historic observations of dissolved oxygen (DO) in the global oceans from 1958 to 2015 quantitatively prove a significantly negative correlation between the DO and ocean heat content (OHC). Yes, our oceans are losing oxygen.

Sounds familiar? But, this study goes further. It shows that deeper water is losing more oxygen than the water at shallower depths. The reason? Deeper ocean is storing more heat. I regret that I cannot show the disturbing graphs here. Check out the paper by clicking the link below.

Reference: Ito, T., Minobe, S., Long, M. C., & Deutsch, C. (2017). Upper Ocean O2 Trends: 1958–2015. Geophysical Research Letters, (In Press), n/a–n/a. [Full-text at https://doi.org/10.1002/2017GL073613]


Figure: Global map of the linear trend of dissolved oxygen at the depth of 100 meters. (Credit: Georgia Tech)

Friday, April 21, 2017

“Protecting 50 % of Earth’s Surface Area”: the CBD’s Equivalent Goal to the UNFCCC’s Target of “Limiting Surface Temperature Rise to 2 Degrees”


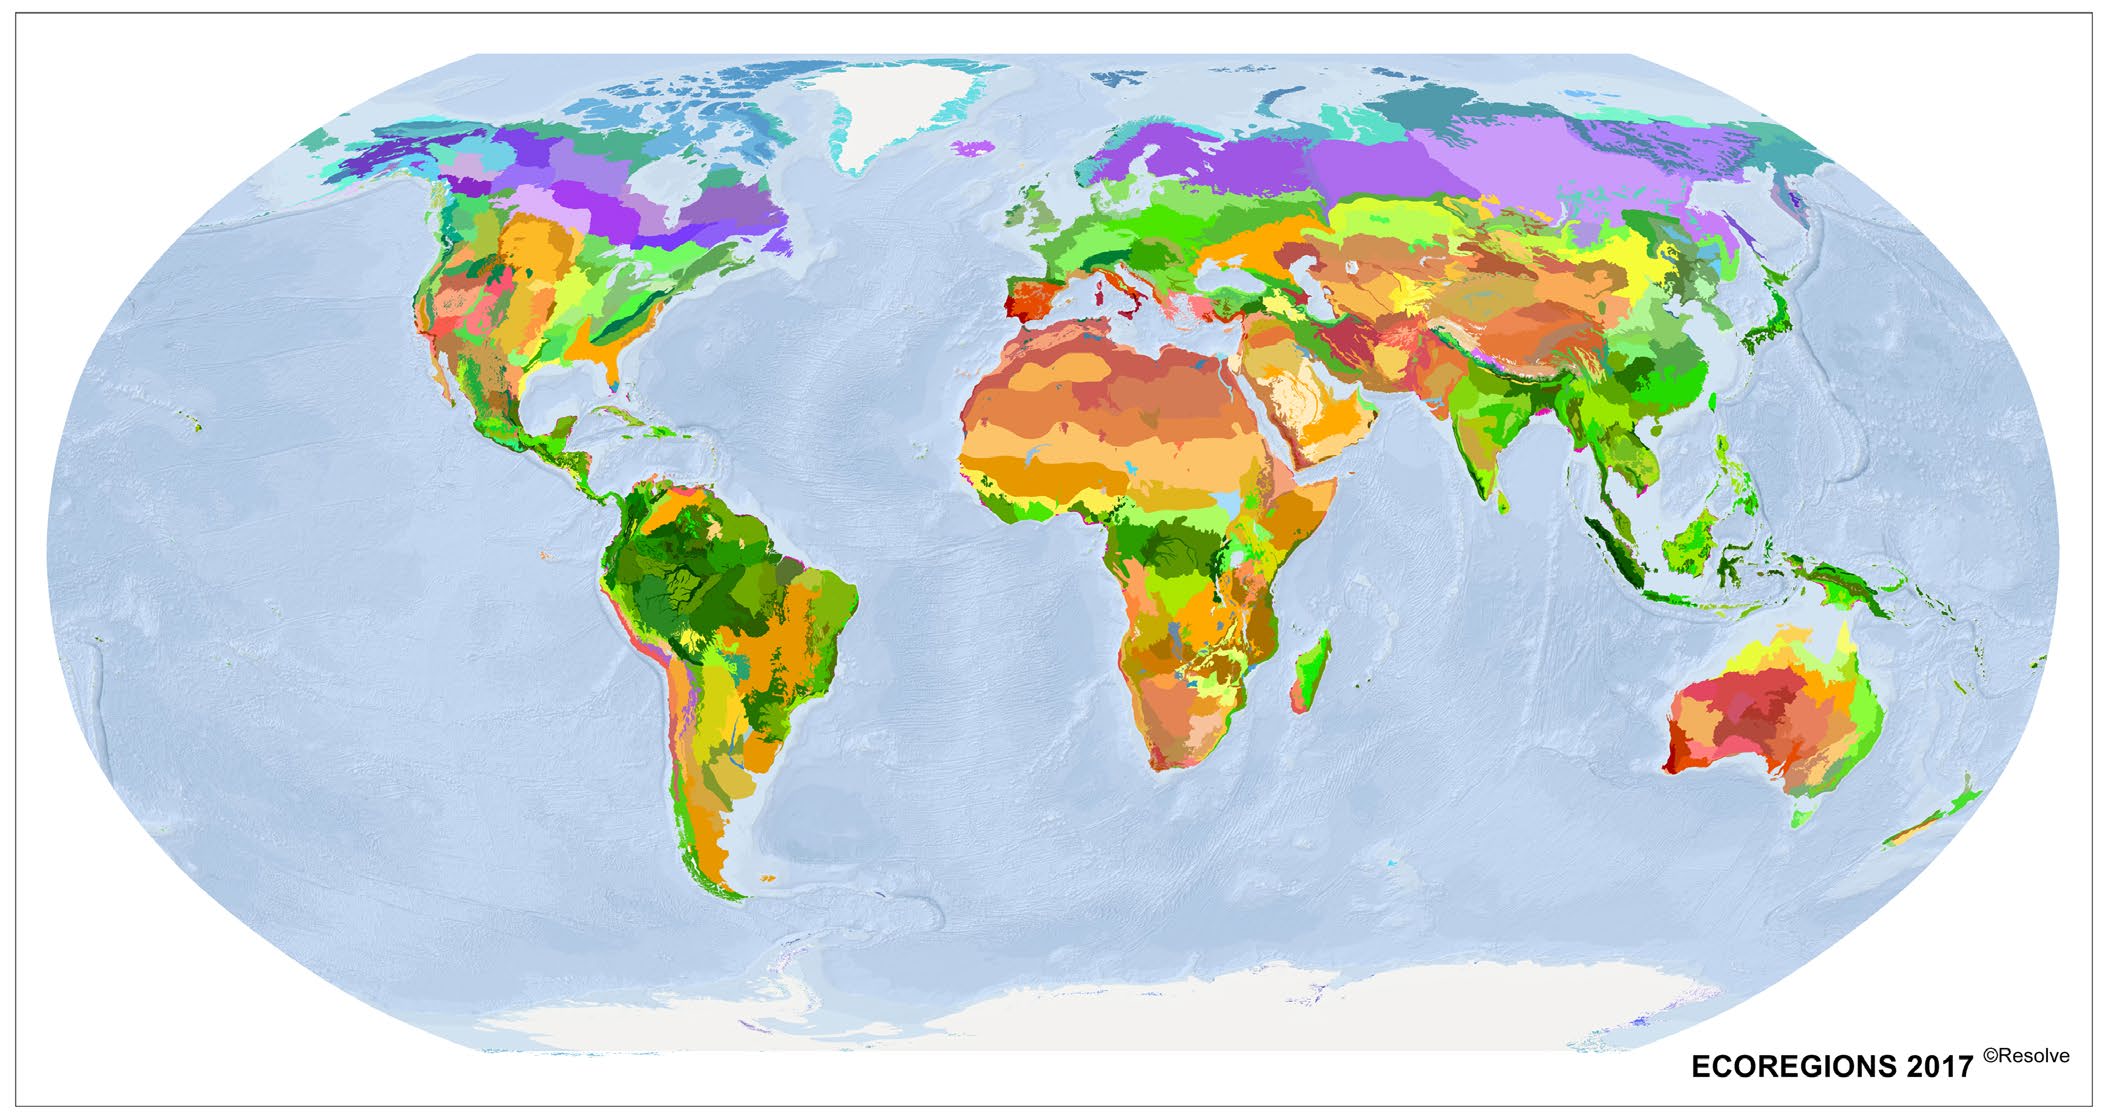
Source: Dinerstein et al., 2017

I thought Edward O. Wilson was the first person who called for protecting half of the global terrestrial area in order to avoid catastrophic mass extinctions. Now, however, I learned the “Half-Earth” (Wilson, 2016) or “Nature Needs Half” (Locke, 2013) slogans have a decades-long robust scientific consensus among conservation biologists, dating back to Odum brothers’ 1972 paper. This month, a group of scientists published a comprehensive review paper (Dinerstein et al., 2017) in BioScience along with online thematic maps of 864 ecoregions distributed among the Earth’s 14 terrestrial biomes at http://ecoregions2017.appspot.com/.

For this paper, the authors have updated the famous 2001 ecoregions map. Then they assessed the extent of both protected areas and remaining natural habitat withing each (forested and nonforested) ecoregion. Previously, about 15 % of global land was known to be protected. According to this new analysis, only 12 % of the terrestrial biosphere (13 % of forested biomes and 10 % of nonforested biomes) is protected. So the authors suggest that the global efforts increase the amount of land under formal protection by 8 to 10 % per decade, while the current increase rate is 4 % per decade.

So, I think the Convention on Biological Diversity can set the “Half-Earth” as a tentative global goal that is its equivalent target to the UNFCCC’s goal of limiting global warming under 2 degrees Celsius from pre-industrial global average surface temperature. Of course, when the IPBES’s global assessment on biodiversity and ecosystem services is published in 2019 (2nd quarter), the official global target endorsed by policymakers might become stricter, just as the Paris Agreement called for limiting the temperature increase to “below 1.5 degrees Celsius” above pre-industrial levels, even further than IPCC’s previous recommendation of 2 degrees-warming.

References:

Dinerstein, E., et al. (2017). An Ecoregion-Based Approach to Protecting Half the Terrestrial Realm. BioScience, 67(6), 534–545. [Full-text at http://doi.org/10.1093/biosci/bix014]

Locke, H. (2013). Nature Needs Half: A Necessary and Hopeful New Agenda for Protected Areas. Parks, 19(2), 9–18. [Full-text at http://j.mp/Locke2013]

Odum, E. D., & Odum, H. T. (1972). Natural Areas as Necessary Components of Man’s Total Environment. In Transactions of the North American Wildlife and Natural Resources Conference (pp. 178–189). Washington, DC: Wildlife Management Institute.

Wilson, E. O. (2016). Half-Earth: Our Planet’s Fight for Life. New York, NY: Liveright.

Sunday, April 2, 2017

Analytical Conceptual Frameworks of IPBES: An Update

This is a minor update of my previous (June 2014) post (“Analytical Conceptual Frameworks of IPBES”) at http://j.mp/IPBES. There was a small change from the Intergovernmental Platform on Biodiversity and Ecosystem Services (IPBES).

The “Nature’s Benefits to People,” a key component of the IPBES’s analytical conceptual frameworks, was renamed to “Nature’s Contributions to People” (NCP) by the October 2016 decision of the platform’s Multidisciplinary Expert Panel (MEP) for the following two reasons (see IPBES/5/INF/24):
  1. The word “benefits”, with its strongly positive connotation, wrongly conveyed the idea that negative contributions from nature towards peoples’ good quality of life would be excluded.
  2. The different meanings of the word “benefits” in common speech in different languages as well as in the social sciences and the valuation literature represented potential sources of confusion. 
Therefore, NCP represents of two contributions that people obtain from nature (Pascual et al., 2017):
  1. All the positive contributions or benefits
  2. Occasionally negative contributions, losses or detriments
So, I have updated the Analytical Conceptual Frameworks of IPBES. Please note that “only images and web-links” are updated. All the remaining are the same.


Analytical Conceptual Frameworks of IPBES: An Update

Now the IPCC's Fifth Assessment Reports (a.k.a. AR5) are all released except the Synthesis part. There is a relatively new IPCC-like intergovernmental organization focusing on biodiversity and ecosystem services.
The Intergovernmental Science-Policy Platform on Biodiversity and Ecosystem Services, or IPBES, has launched in 2012.
I welcome this new organization wholeheartedly. See, the title of my blog is "Energy and Ecology." If the IPCC is more about energy (as a means of climate change mitigation), the IPBES is more about ecology.
Just as the IPCC has done to connect science and policy since the publication of the First Assessment Report (FAR) in 1990, the IPBES is planning to generate timely assessment reports regularly for the world's policymakers. The first global assessment of the IPBES is scheduled to be published by 2018 and will replace the Millennium Ecosystem Assessment (published by WRI, UNEP, the World Bank, and UNDP in 2005) as the most authoritative report on the status of the Earth's biomes and ecosystems.
The following figures are a beautified version of the IPBES's analytical conceptual framework and operational conceptual model drawn by the Platform's experts at the 2013 IPBES's second Plenary (IPBES-2). These figures will provide a basis of future IPBES studies. In the analytical framework (Figure 1), there are six building-blocks and two big arrows representing spatial and temporal scales each. The operational model (Figure 2) explains how science and policy interacts with each other through the IPBES processes, while the analytical framework supports the four functions of the IPBES – knowledge generation, assessments, policy support tools and methodologies, and capacity-building.
These figures appear to be influenced by the conceptual framework of the United Kingdom's 2011 National Ecosystem Assessment (2011) as well as that of the United Nations Millennium Ecosystem Assessment (2005). Interestingly, the IPBES analytical conceptual framework has made the UK NEA framework updated as manifested in its follow-on phase report (2014) (Figure 3). A detailed explanation of Figures 1 and 2 can be found in the IPBES-2 report (2014) and could be compared with the conceptual framework of the Millennium Ecosystem Assessment.

Figure 1. IPBES Analytical Conceptual Framework
(vector [emf] image: http://j.mp/IPBES-ACF)

Source: My drawing based on IPBES-5.


Figure 2. Operational Conceptual Model of the IPBES
(vector [emf] image: http://j.mp/IPBES-OCM)


Source: My drawing based on IPBES-5.

Figure 3. UK NEA Follow-on Phase Ecosystem Services Conceptual Framework

Source: My drawing based on UK NEA FO.


Reference: Pascual, U., Balvanera, P., Díaz, S., Pataki, G., Roth, E., Stenseke, M., . . . Yagi, N. (2017). Valuing nature’s contributions to people: the IPBES approach. Current Opinion in Environmental Sustainability, 26–27, 7–16. doi:10.1016/j.cosust.2016.12.006

Sunday, February 19, 2017

Cost of Energy Comparison, Including Levelized Cost of Energy (LCOE)—2017 Update

I updated the list in a new post for the year of 2018. Please move to the post cited below.
Park, H. (2018). Cost of Energy Comparison, Including Levelized Cost of Energy (LCOE)—2018 Update [Blog post]. Retrieved from http://j.mp/LCOE_2018