Thursday, November 29, 2018

Three takeaways from UNEP’s “The Emissions Gap Report 2018”

A few days ago, the United Nations Environment Programme released the latest version of its annual global climate action assessment, “The Emissions Gap Report 2018.”

I picked up three takeaways from the report:

(A) “Global peaking of emissions by 2020 is crucial for achieving the temperature targets of the Paris Agreement” ⋯ [Yet,] “global emissions are not estimated to peak by 2030, let alone by 2020.”

(B) ⋯ “this original level of ambition [of the current Nationally Determined Contributions] needs to be roughly tripled for the 2 °C scenario and increased around fivefold for the 1.5 °C scenario.”

(C) “If international cooperative initiatives [of Non-state and Subnational Actors] are scaled up to their fullest potential, the impact could be ⋯ up to 19 GtCO2e/year by 2030. If realized, this would be instrumental in bridging the emissions gap to 2 °C pathways.”


Figure Above: Explaining takeaways (A) and (B).


Figure Above: Explaining takeaway (C).

Source: UNEP. (2018). The Emissions Gap Report 2018. Nairobi, Kenya: United Nations Environment Programme (UNEP). [Full-text at http://j.mp/UNEP-EGR2018]
Saturday, October 6, 2018

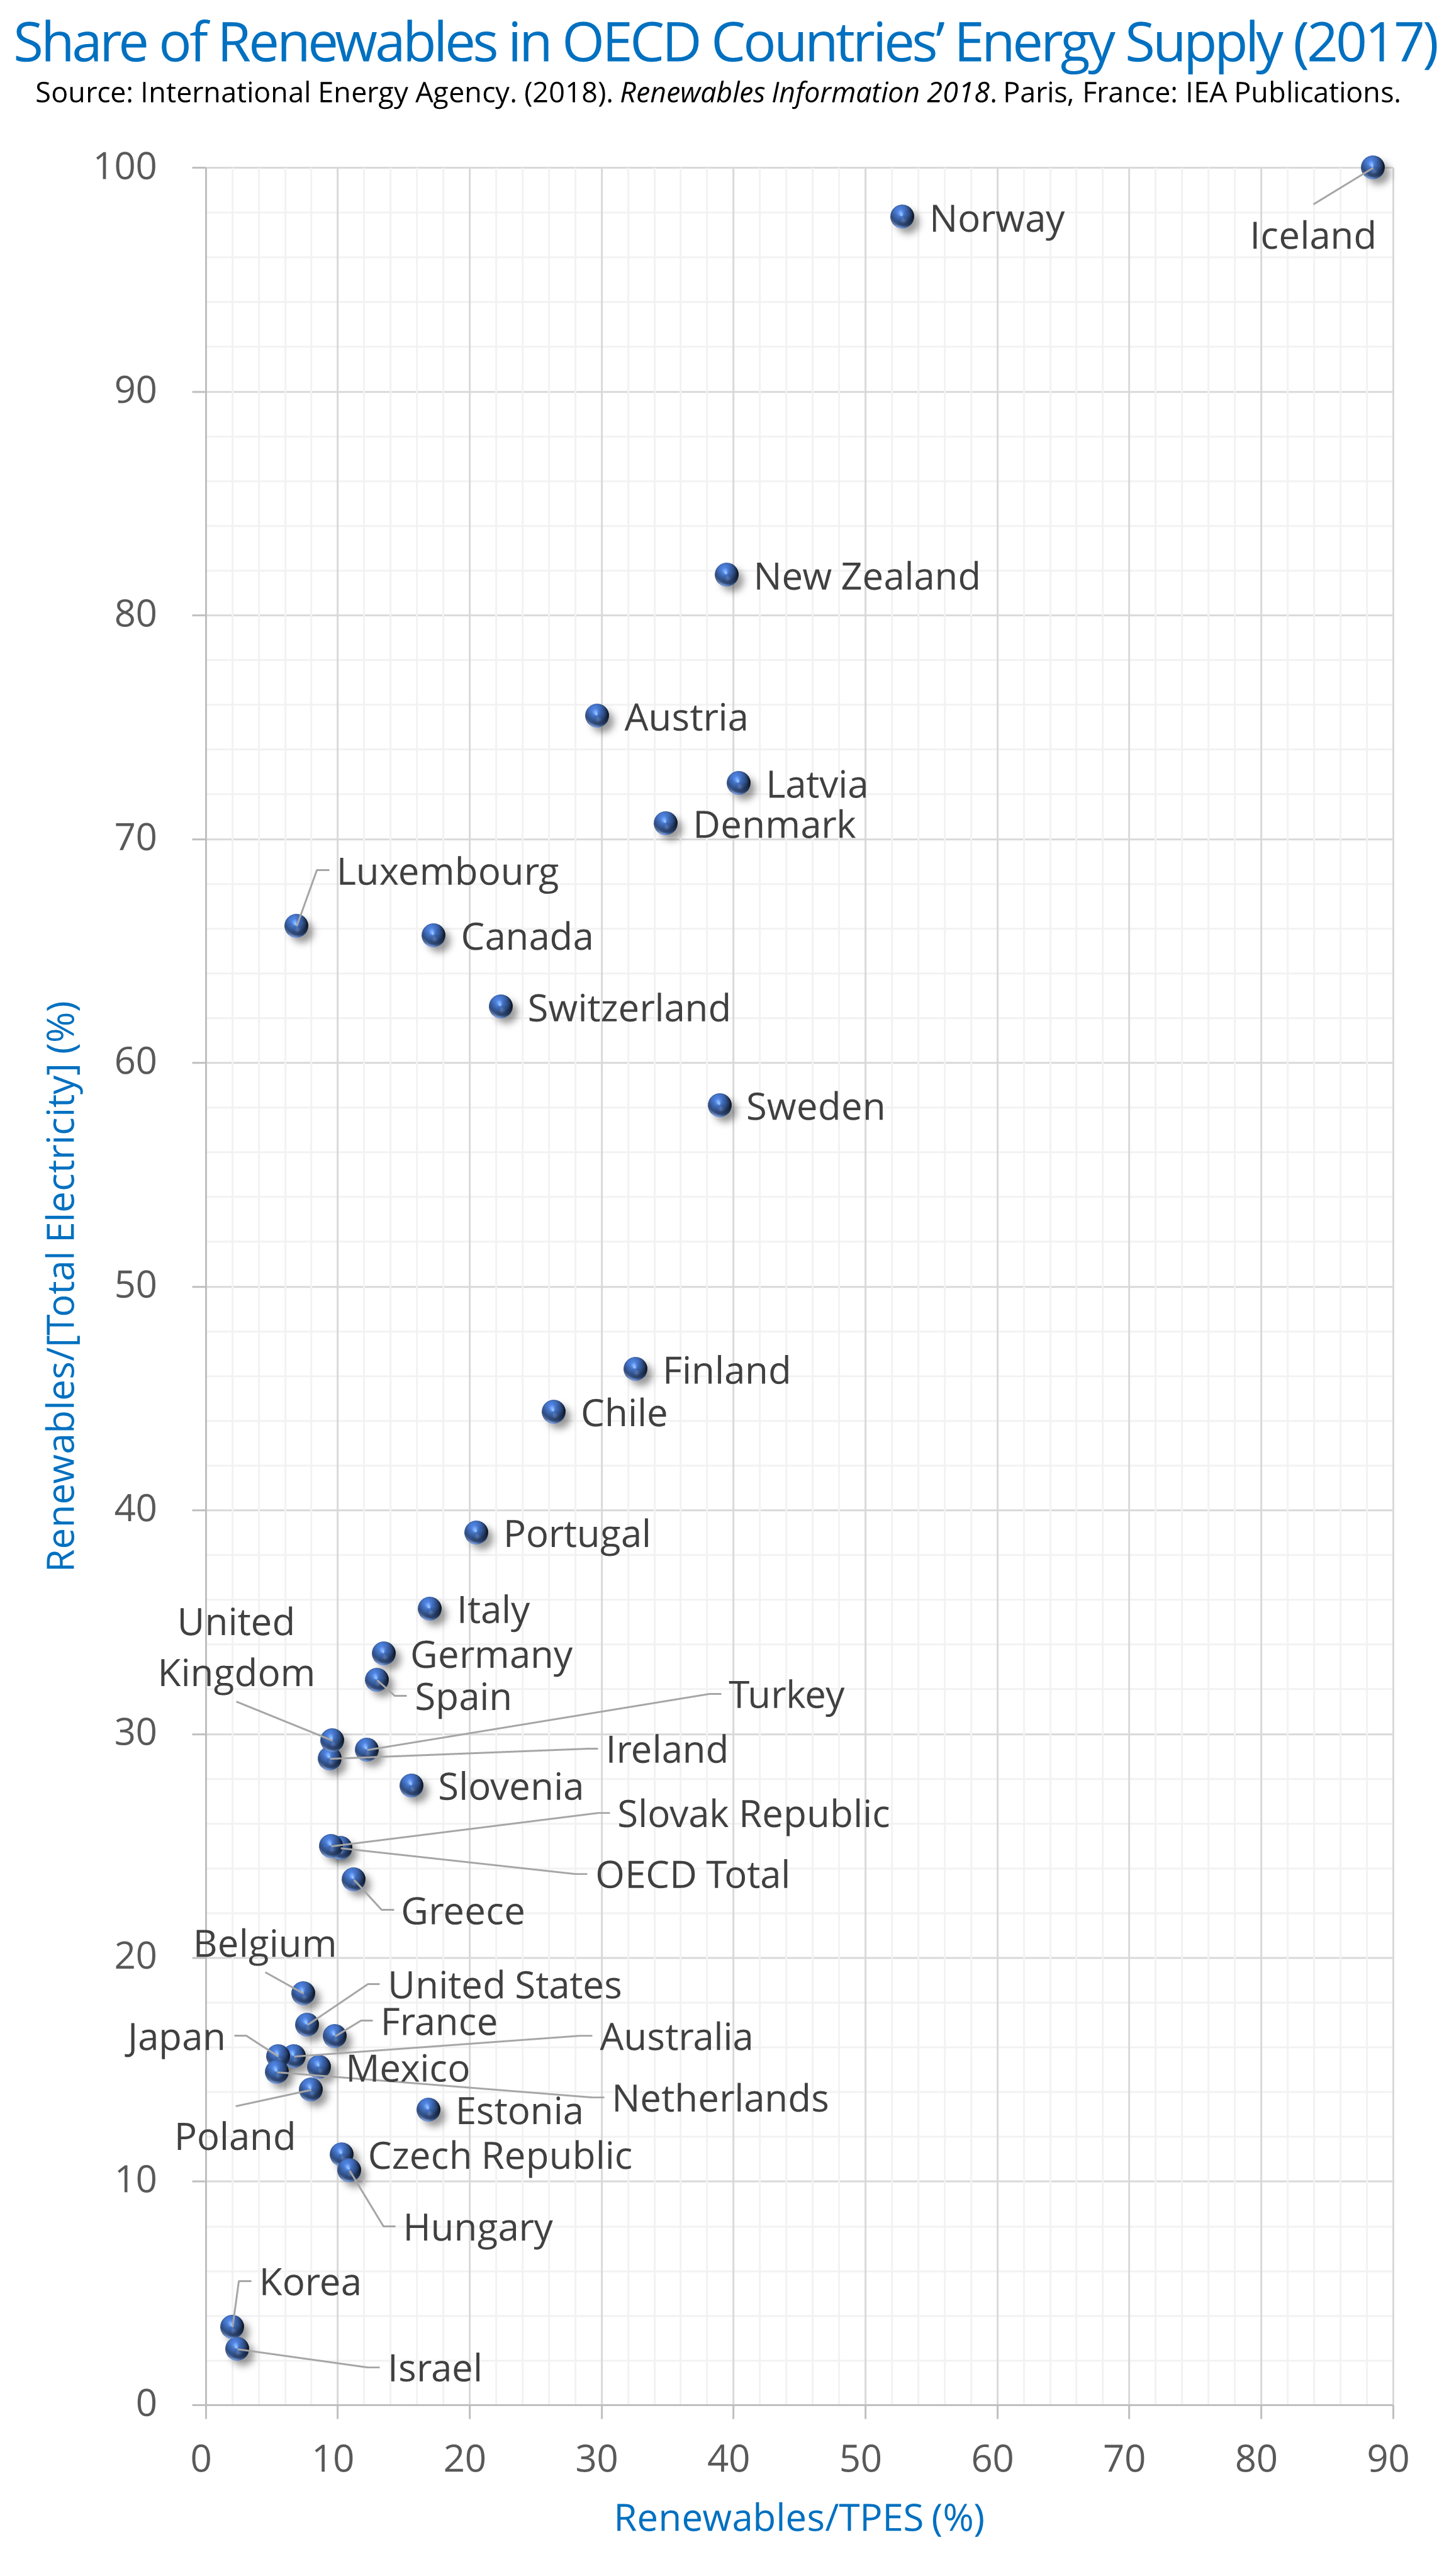
Share of Renewables in OECD Countries’ Energy Supply in 2017

X axis: Renewables/[Total Primary Energy Supply]
Y axis: Renewables/[Total Electricity]

http://j.mp/OECD-Renewables2018


Source: International Energy Agency. (2018). Renewables Information 2018. Paris, France: IEA Publications.

Wednesday, July 4, 2018

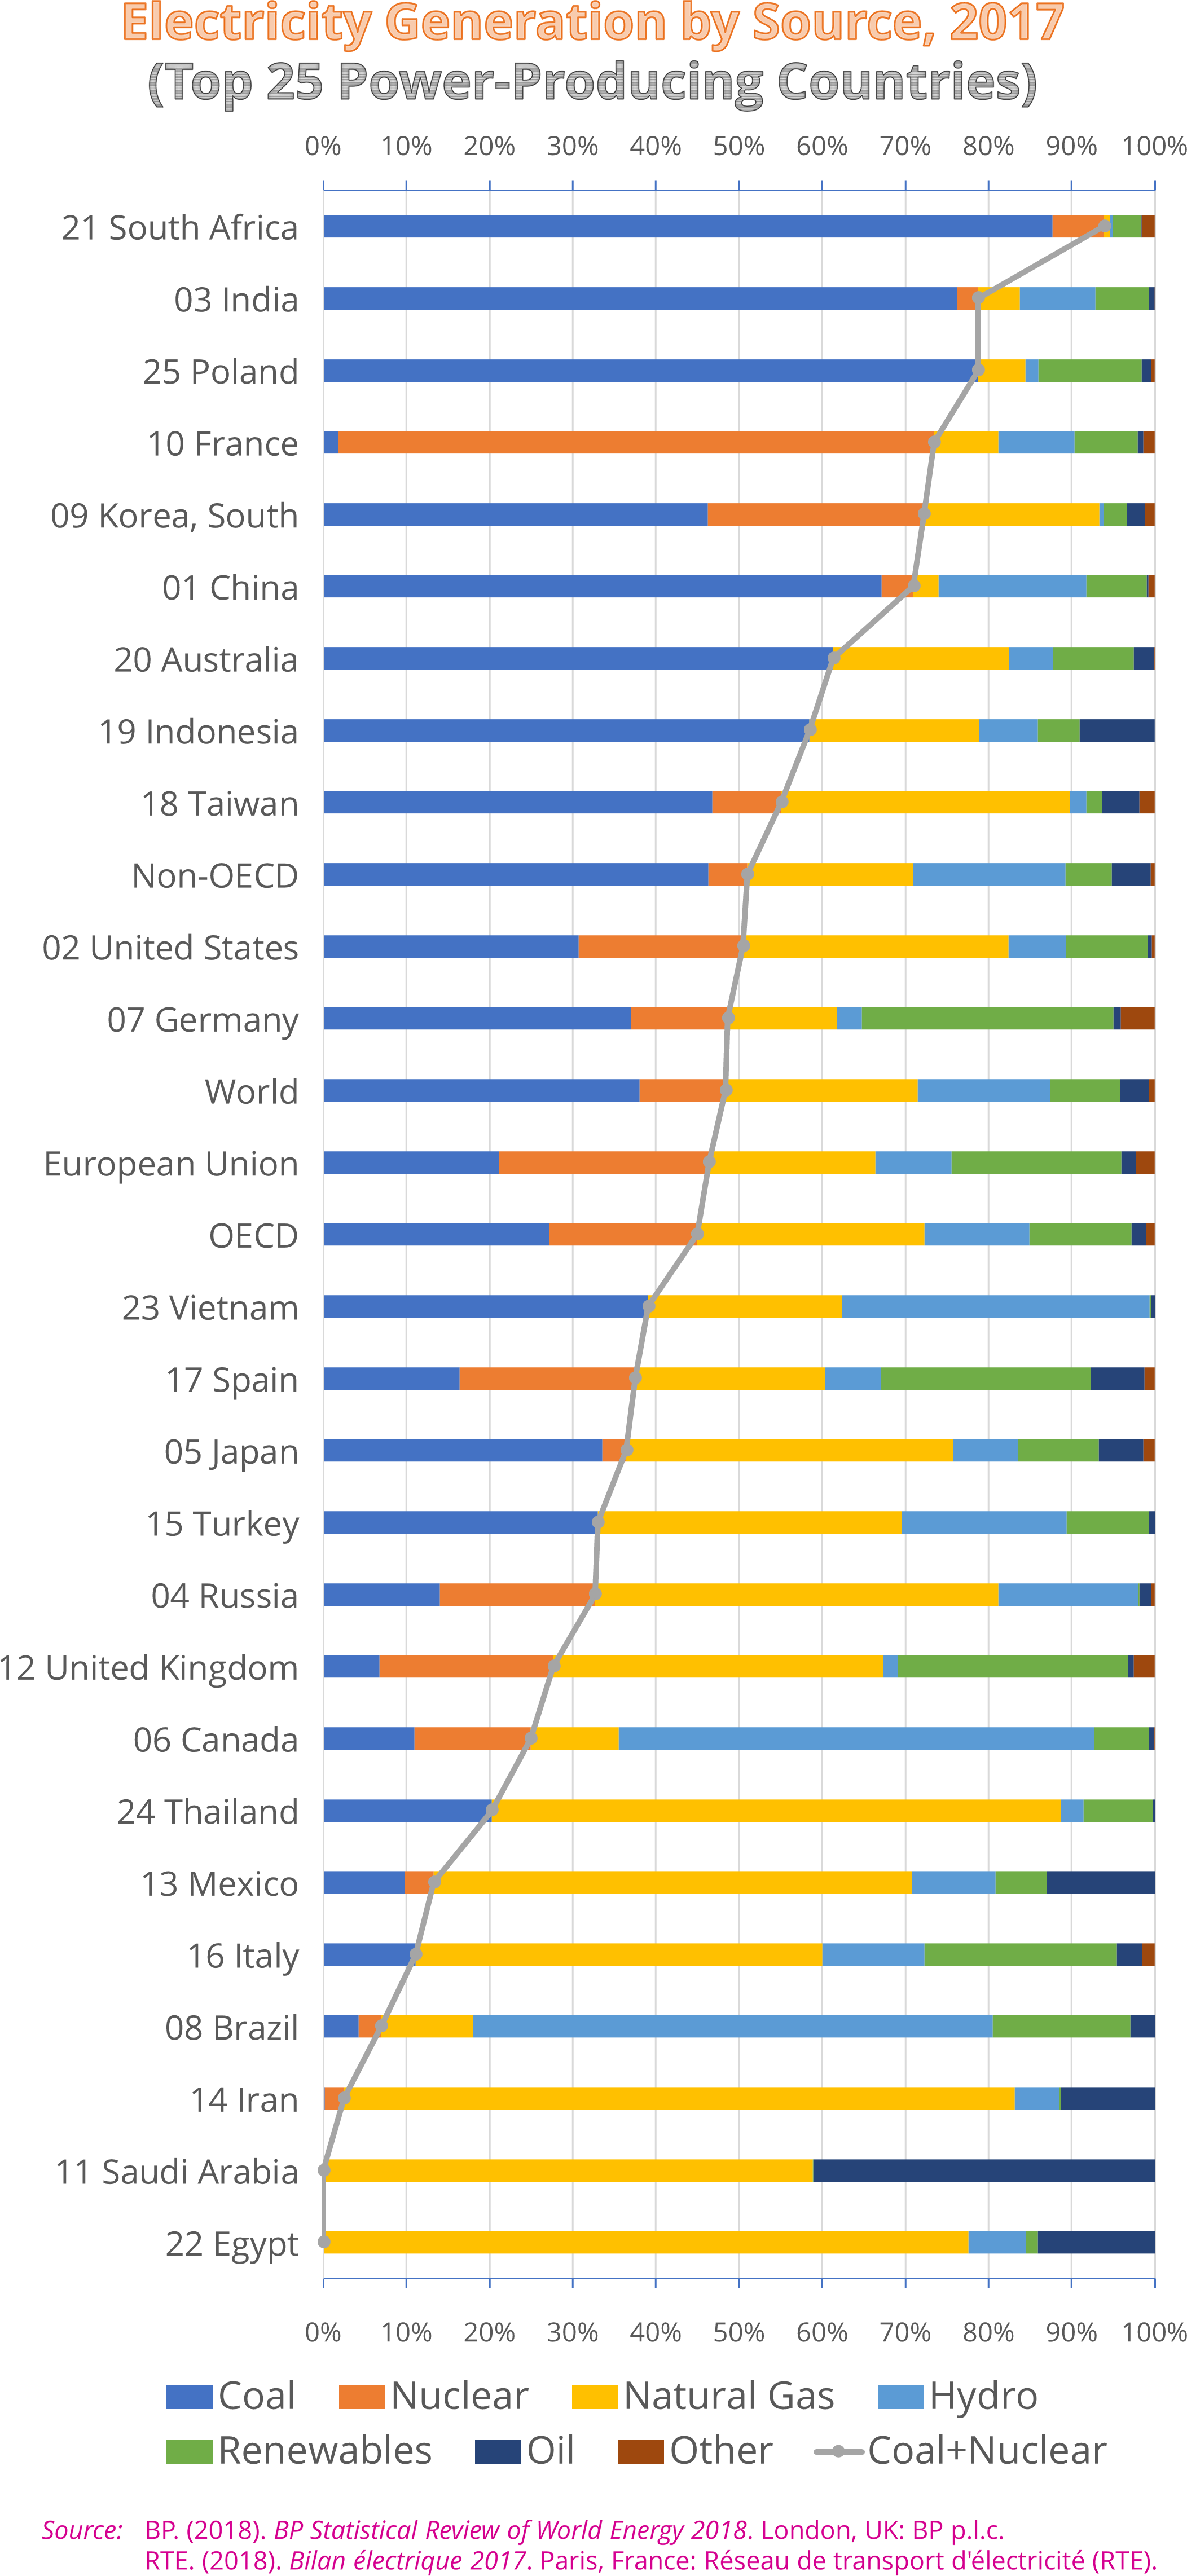
Electricity Generation by Source, 2017 -- Top 25 Power-Producing Countries

Who is leading the transition towards a cleaner and safer energy mix?


Data source:
BP. (2018). BP Statistical Review of World Energy 2018. London, UK: BP p.l.c.
RTE. (2018). Bilan électrique 2017. Paris, France: Réseau de transport d'électricité (RTE).

Friday, March 23, 2018

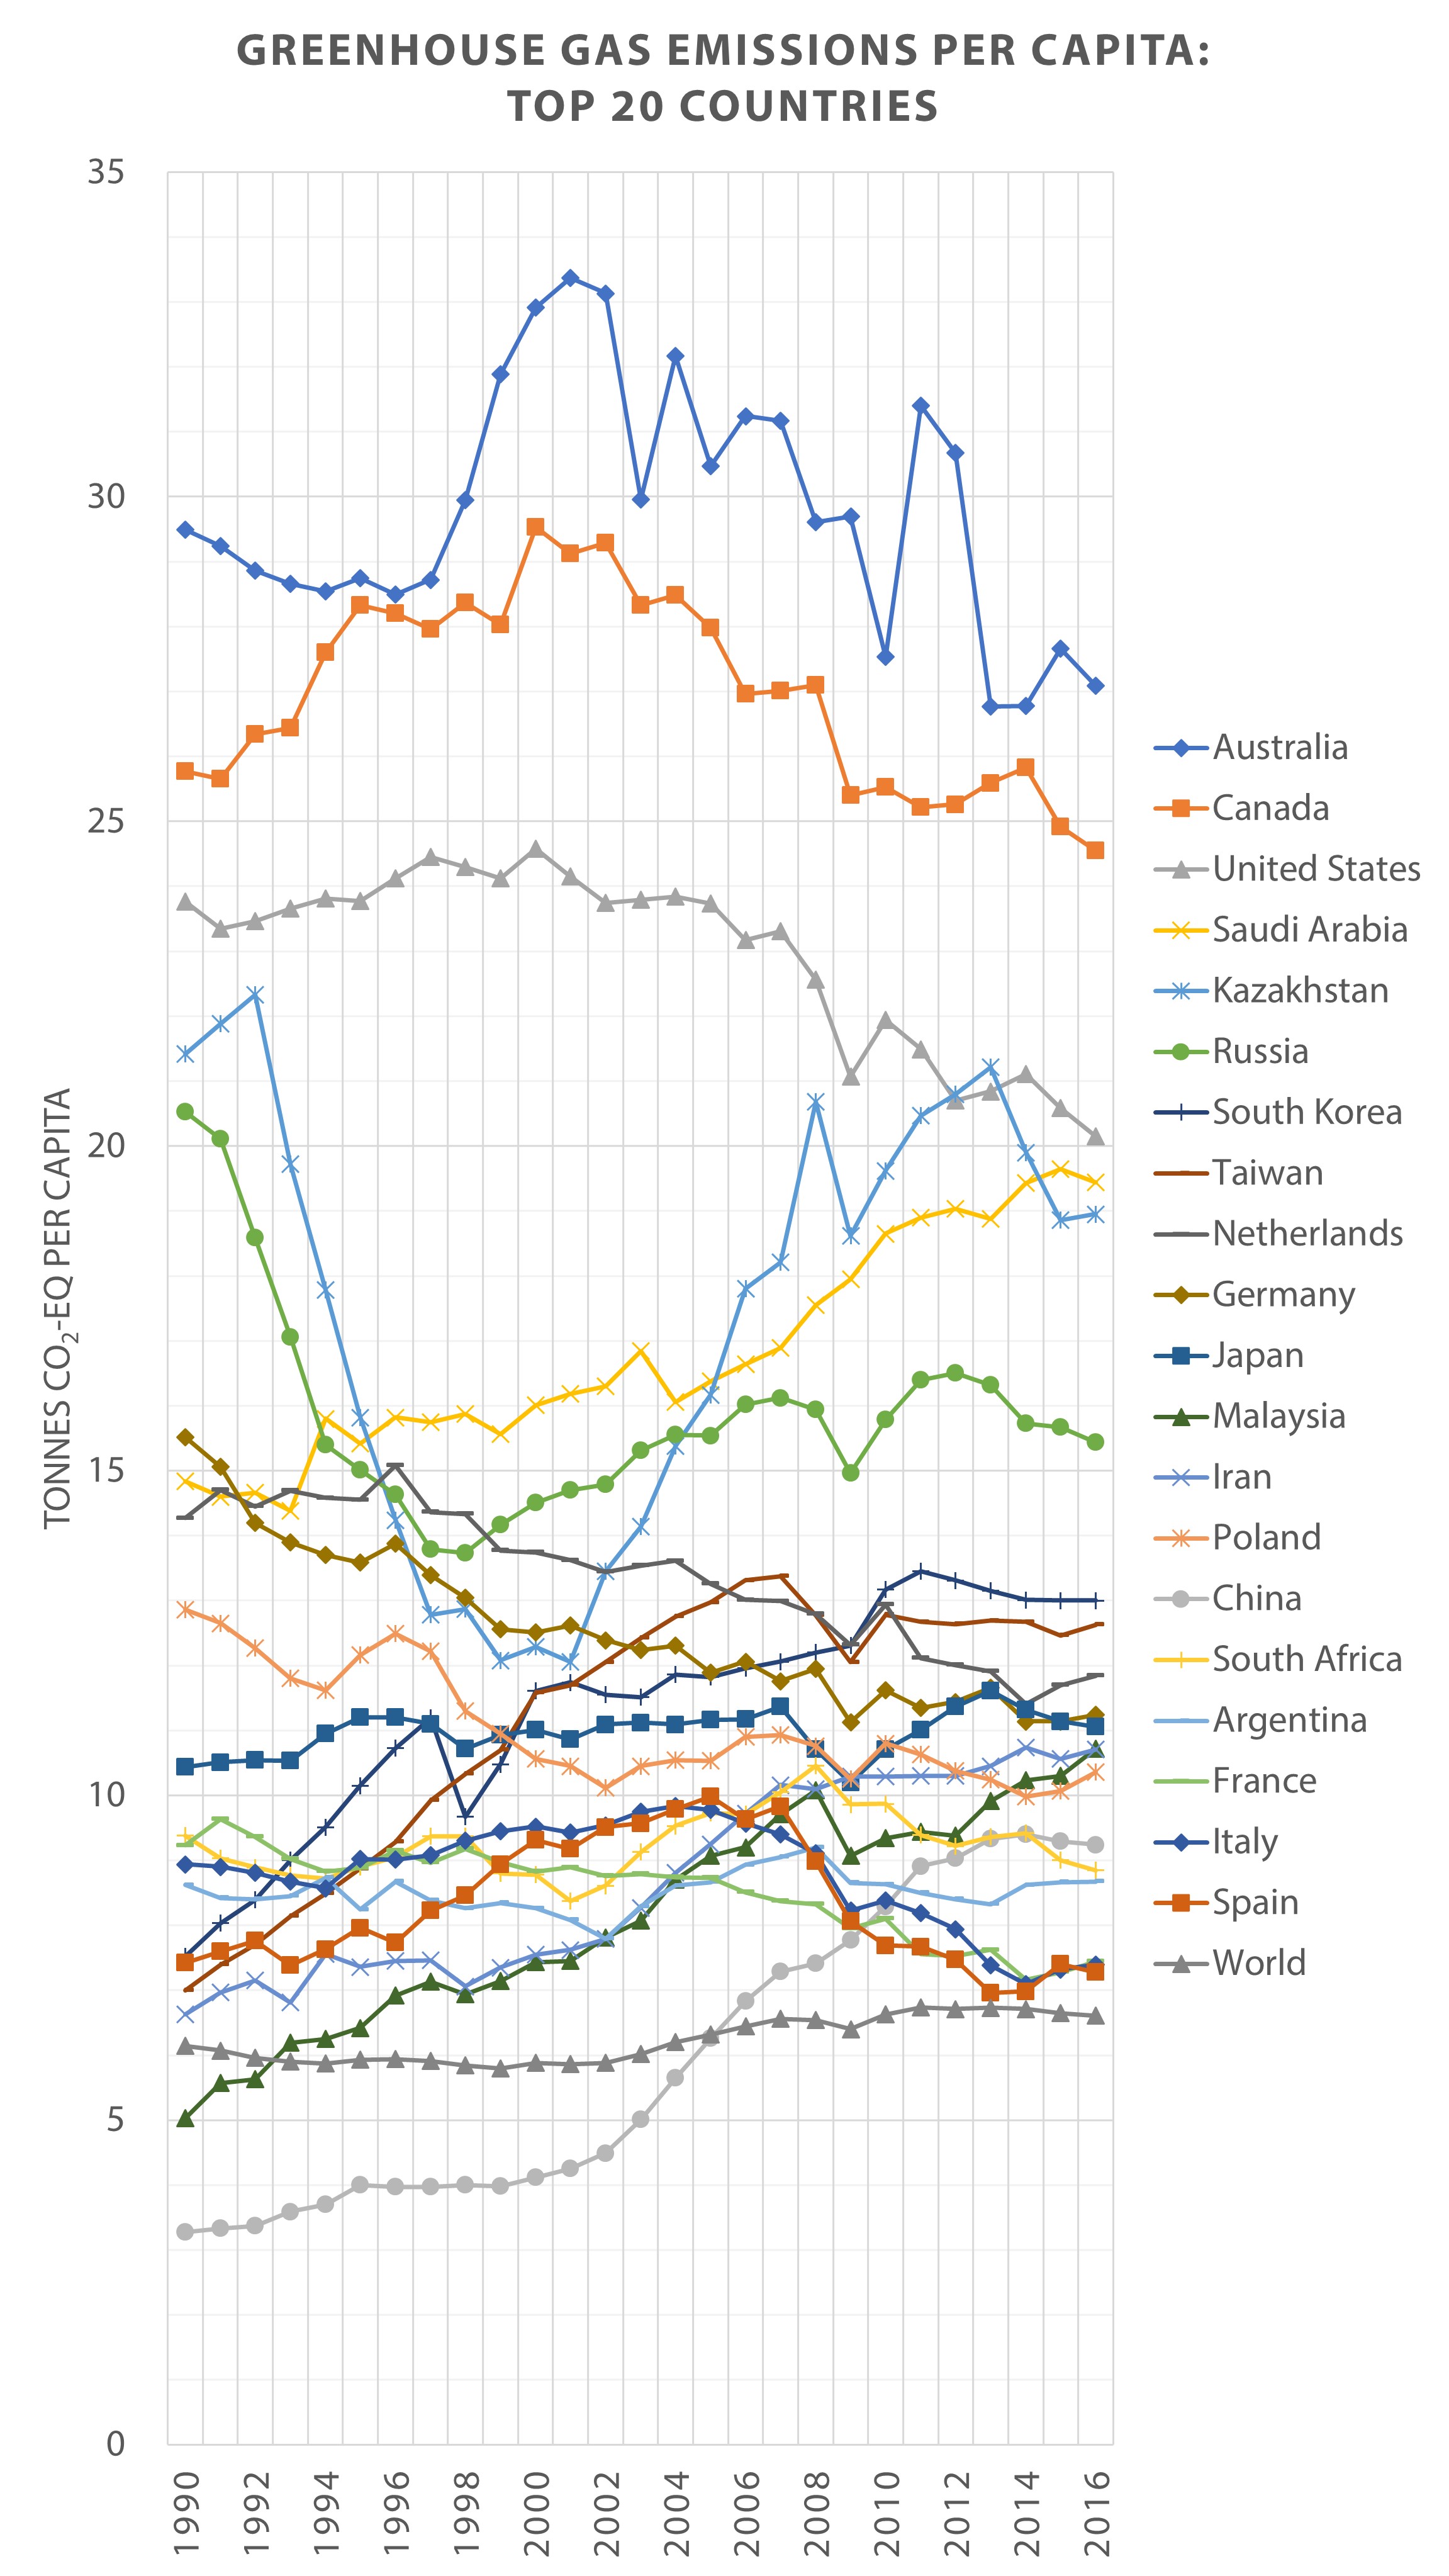
Greenhouse Gas Emissions per Capita: Top 20 Countries in 2016

The graph below renders a different picture of how people around the world are warming the Earth by accounting for all Kyoto protocol greenhouse gases, not just carbon dioxide.


Source: Olivier, J. G. J., Schure, K. M., & Peters, J. A. H. W. (2017). Trends in Global CO2 and Total Greenhouse Gas Emissions: 2017 Report. The Hague, The Netherlands: Planbureau voor de Leefomgeving (PBL; Netherlands Environmental Assessment Agency).

Wednesday, March 7, 2018

State of Deforestation by Country, 1990-2015

Can the deforestation be stopped and then reversed? Reforested areas could be a good source of additional carbon sinks.

Forest Area by Country
Unit: km2
Deforestation
Rank
Country199020151990–2015CAGR
(’90–’15)
1Togo6,8501,880-72.55%-5.04%
2Nigeria172,34069,930-59.42%-3.54%
3Uganda47,51020,770-56.28%-3.26%
4Mauritania4,1502,245-45.90%-2.43%
5Honduras81,36045,920-43.56%-2.26%
6Pakistan25,27014,720-41.75%-2.14%
7Niger19,45011,420-41.29%-2.11%
8Korea, North82,01050,310-38.65%-1.94%
9Sudan307,273192,099-37.48%-1.86%
10Zimbabwe221,640140,620-36.55%-1.80%
11Nicaragua45,14031,140-31.01%-1.47%
12El Salvador3,7702,650-29.71%-1.40%
13Mali66,90047,150-29.52%-1.39%
14Timor-Leste9,6606,860-28.99%-1.36%
15Paraguay211,570153,230-27.57%-1.28%
16Chad67,05048,750-27.29%-1.27%
17Cambodia129,44094,570-26.94%-1.25%
18Myanmar392,180290,410-25.95%-1.19%
19Guatemala47,48035,400-25.44%-1.17%
20Virgin Islands (U.S.)236176-25.36%-1.16%
21Ethiopia167,350124,990-25.31%-1.16%
22Benin57,61043,110-25.17%-1.15%
23Nepal48,17036,360-24.52%-1.12%
24Comoros490370-24.49%-1.12%
25Kyrgyzstan8,3606,370-23.80%-1.08%
26Indonesia1,185,450910,100-23.23%-1.05%
27Somalia82,82063,630-23.17%-1.05%
28Cameroon243,160188,160-22.62%-1.02%
29Argentina347,930271,120-22.08%-0.99%
30Burkina Faso68,47053,500-21.86%-0.98%
31Namibia87,62069,190-21.03%-0.94%
32Botswana137,180108,400-20.98%-0.94%
33Malawi38,96031,470-19.22%-0.85%
34Tanzania559,200460,600-17.63%-0.77%
35Haiti1,160970-16.38%-0.71%
36Equatorial Guinea18,60015,680-15.70%-0.68%
37Belize16,16013,663-15.45%-0.67%
38Liberia49,29041,790-15.22%-0.66%
39Ecuador146,309125,479-14.24%-0.61%
40Dominica500433-13.34%-0.57%
41Northern Mariana Islands340295-13.24%-0.57%
42Bolivia627,950547,640-12.79%-0.55%
43Mozambique433,780379,400-12.54%-0.53%
44Guinea72,64063,640-12.39%-0.53%
45Senegal93,48082,730-11.50%-0.49%
46Guinea-Bissau22,16019,720-11.01%-0.47%
47Venezuela520,260466,830-10.27%-0.43%
48Brazil5,467,0504,935,380-9.72%-0.41%
49Sri Lanka22,84020,700-9.37%-0.39%
50Colombia644,170585,017-9.18%-0.38%
51Madagascar136,920124,730-8.90%-0.37%
52Panama50,40046,170-8.39%-0.35%
53Brunei4,1303,800-7.99%-0.33%
54Zambia528,000486,350-7.89%-0.33%
55Portugal34,36031,820-7.39%-0.31%
56St. Lucia218203-6.88%-0.28%
57Eritrea16,21015,100-6.85%-0.28%
58Kenya47,24044,130-6.58%-0.27%
59Mauritius411386-6.08%-0.25%
60Solomon Islands23,24021,850-5.98%-0.25%
61Mexico697,600660,400-5.33%-0.22%
62Angola609,760578,560-5.12%-0.21%
63Peru779,210739,730-5.07%-0.21%
64Congo, Dem. Rep.1,603,6301,525,780-4.85%-0.20%
65Antigua and Barbuda10398-4.85%-0.20%
66American Samoa184175-4.62%-0.19%
67Burundi2,8902,760-4.50%-0.18%
68Bangladesh14,94014,290-4.35%-0.18%
69Sao Tome and Principe560536-4.29%-0.18%
70Kazakhstan34,22033,090-3.30%-0.13%

World41,282,69539,991,336-3.13%-0.13%
71Australia1,285,4101,247,510-2.95%-0.12%
72Korea, South63,70061,840-2.92%-0.12%
73Marshall Islands130126-2.77%-0.11%
74Jamaica3,4463,352-2.73%-0.11%
75Trinidad and Tobago2,4072,345-2.58%-0.10%
76British Virgin Islands3736-2.43%-0.10%
77Sierra Leone31,18030,440-2.37%-0.10%
78Albania7,8887,715-2.19%-0.09%
79Central African Republic225,600221,700-1.73%-0.07%
80Congo, Rep.227,260223,340-1.72%-0.07%
81Bosnia and Herzegovina22,10021,850-1.13%-0.05%
82Armenia3,3503,320-0.90%-0.04%
83Malaysia223,760221,950-0.81%-0.03%
84Guyana166,600165,260-0.80%-0.03%
85Suriname154,300153,320-0.64%-0.03%
86Canada3,482,7303,470,690-0.35%-0.01%
87Luxembourg870867-0.34%-0.01%
88Papua New Guinea336,270335,590-0.20%-0.01%
89Norway121,320121,120-0.16%-0.01%
90Afghanistan13,50013,5000.00%0.00%
90Andorra1601600.00%0.00%
90Aruba440.00%0.00%
90Bahamas5,1505,1500.00%0.00%
90Barbados63630.00%0.00%
90Bermuda10100.00%0.00%
90Cayman Islands1271270.00%0.00%
90Channel Islands880.00%0.00%
90Djibouti56560.00%0.00%
90Faroe Islands110.00%0.00%
90Greenland220.00%0.00%
90Grenada1701700.00%0.00%
90Guam2502500.00%0.00%
90Isle of Man35350.00%0.00%
90Jordan9759750.00%0.00%
90Kiribati1221220.00%0.00%
90Libya2,1702,1700.00%0.00%
90Maldives10100.00%0.00%
90Malta440.00%0.00%
90New Caledonia8,3908,3900.00%0.00%
90Oman20200.00%0.00%
90Saudi Arabia9,7709,7700.00%0.00%
90Seychelles4074070.00%0.00%
90Singapore1641640.00%0.00%
90South Africa92,41092,4100.00%0.00%
90St. Kitts and Nevis1101100.00%0.00%
90St. Martin (French part)10100.00%0.00%
90Tonga90900.00%0.00%
90Turkmenistan41,27041,2700.00%0.00%
90Turks and Caicos Islands3443440.00%0.00%
90Tuvalu10100.00%0.00%
90Vanuatu4,4004,4000.00%0.00%
90Yemen5,4905,4900.00%0.00%
123Japan249,500249,5800.03%0.00%
124Sweden280,630280,7300.04%0.00%
125Mongolia125,360125,5280.13%0.01%
126Micronesia6406430.42%0.02%
127Russia8,089,5008,149,3050.74%0.03%
128Slovak Republic19,22019,4000.94%0.04%
129Tajikistan4,0804,1200.98%0.04%
130West Bank and Gaza91920.99%0.04%
131Germany113,000114,1901.05%0.04%
132Estonia22,06022,3201.18%0.05%
133Czech Republic26,29026,6701.45%0.06%
134Finland218,750222,1801.57%0.06%
135Cote d'Ivoire102,220104,0101.75%0.07%
136Belgium6,6706,8342.46%0.10%
137Austria37,76038,6902.46%0.10%
138United States3,024,5003,100,9502.53%0.10%
139Georgia27,52028,2242.56%0.10%
140Iraq8,0408,2502.61%0.10%
141Croatia18,50019,2203.89%0.15%
142Ukraine92,74096,5704.13%0.16%
143Gabon220,000230,0004.55%0.18%
144Lebanon1,3101,3734.81%0.19%
145Slovenia11,88012,4805.05%0.20%
146New Zealand96,580101,5205.11%0.20%
147Uzbekistan30,45032,1995.74%0.22%
148Latvia31,73033,5605.77%0.22%
149Palau3804036.05%0.24%
150Liechtenstein65696.15%0.24%
151Poland88,81094,3506.24%0.24%
152Laos176,449187,6146.33%0.25%
153Fiji9,52910,1726.75%0.26%
154Cyprus1,6111,7277.19%0.28%
155Costa Rica25,64027,5607.49%0.29%
156Romania63,71068,6107.69%0.30%
157St. Vincent and the Grenadines2502708.00%0.31%
158Ghana86,27093,3708.23%0.32%
159Switzerland11,51012,5408.95%0.34%
160Netherlands3,4503,7608.99%0.34%
161Macedonia9,1209,9809.43%0.36%
162Serbia24,76027,2009.85%0.38%
163Bhutan25,06727,5499.90%0.38%
164Gambia4,4204,88010.41%0.40%
165India639,390706,82010.55%0.40%
166Belarus77,80086,33510.97%0.42%
167Lithuania19,45021,80012.08%0.46%
168Denmark5,4326,12212.70%0.48%
169United Kingdom27,78031,44013.17%0.50%
170Morocco49,54056,32013.69%0.51%
171Hungary18,01020,69014.88%0.56%
172Bulgaria33,27038,23014.91%0.56%
173Chile152,630177,35016.20%0.60%
174Thailand140,050163,99017.09%0.63%
175Algeria16,67019,56017.34%0.64%
176France144,360169,89017.68%0.65%
177Iran90,761106,92017.80%0.66%
178Turkey96,220117,15021.75%0.79%
179Italy75,90092,97022.49%0.81%
180Lesotho40049022.50%0.82%
181Philippines65,55080,40022.65%0.82%
182Greece32,99040,54022.89%0.83%
183Swaziland4,7205,86024.15%0.87%
184Israel1,3201,65025.00%0.90%
185Moldova3,1904,09028.21%1.00%
186Samoa1,3001,71031.54%1.10%
187United Arab Emirates2,4503,22631.67%1.11%
188Syria3,7204,91031.99%1.12%
189Montenegro6,2608,27032.11%1.12%
190China1,571,4062,083,21332.57%1.13%
191Spain138,095184,17933.37%1.16%
192Azerbaijan8,52011,39433.73%1.17%
193Rwanda3,1804,80050.94%1.66%
194Cuba20,58032,00055.49%1.78%
195Cabo Verde57889955.67%1.79%
196Vietnam93,630147,73057.78%1.84%
197Tunisia6,43010,41061.90%1.95%
198Ireland4,6507,54062.15%1.95%
199Egypt44073065.91%2.05%
200Puerto Rico2,8704,96072.80%2.21%
201Dominican Republic11,05019,83079.46%2.37%
202Kuwait356381.16%2.41%
203Uruguay7,97818,450131.26%3.41%
204Bahrain26172.73%4.09%
205French Polynesia5501,550181.82%4.23%
206Iceland161492205.59%4.57%
Source: World Bank. (2018). World Development Indicators (Last Updated on March 1, 2018). Washington, DC: World Bank.

Tuesday, January 2, 2018

Cost of Energy Comparison, Including Levelized Cost of Energy (LCOE)—2018 Update

I updated the list in a new post for the year of 2019. Please move to the post cited below.

Park, H. (2019). Cost of Energy Comparison, Including Levelized Cost of Energy (LCOE)—2019 Update [Blog post]. Retrieved from http://j.mp/LCOE_2019